My talk at the XXIV ICRC (1995)
Here is the talk I presented at Rome. Some last-minute hand-made
corrections to the slides have been now added via software and this caused
some quality lost. The conversion from ps to gif has also worsened the
quality. For each slide is given the accompanying speech. Don't mind the
jumping slide numbers at its bottom, I made more than I showed.
Search for Short Time Emission in the UHE Range above 20 TeV
with the HEGRA Detector (talk)
Slide 1:
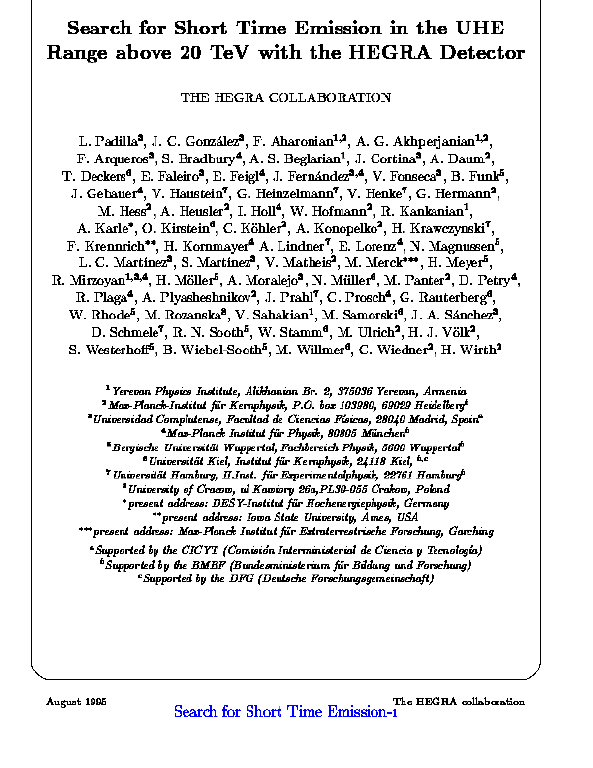 Gamma ray bursts are still an open question in Astrophysics.
Observations with satellites reach a few GeV, so, we have conducted a search
in the TeV region. I present the results of an all sky search for short time
emission above twenty TeV with the HEGRA detector.
The HEGRA cosmic ray detector is operated by an international
collaboration. Institutions are listed here.
Slide 2:
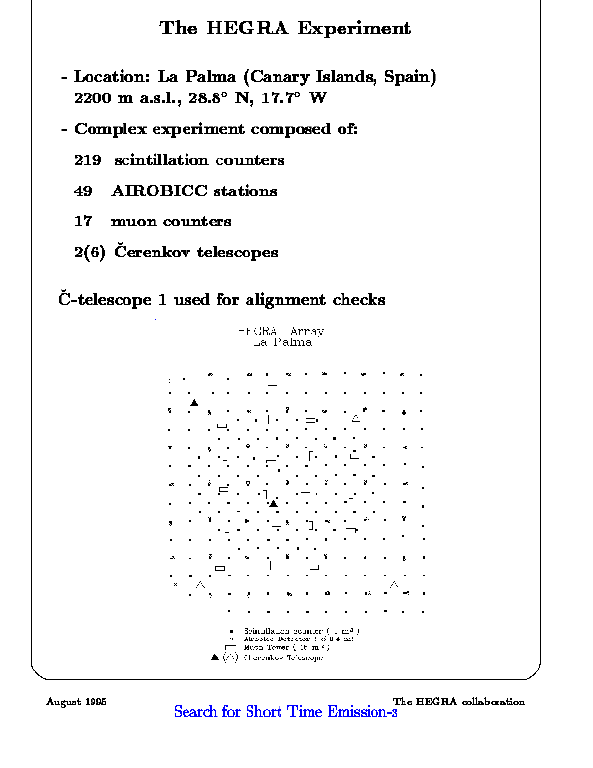 The HEGRA cosmic ray detector complex is located at the Spanish Canary
Island La Palma, twenty two hundred meters above see level. It is composed
of several subdetectors: An array of two hundred and nineteen scintillation
counters, the wide angle Cherenkov detector, named AIROBICC, seventeen muon
counters and two of six future Cherenkov telescopes, all distributed over
an area of about forty thousand square meters.
Slide 3:
 The wide angle Cherenkov detector AIROBICC is an array of seven by
seven stations with a grid spacing of thirty meters. Each station has one
photomultiplier tube detecting the Cherenkov light pulses produced by
extended air showers. A trigger is produced when at least six stations are
fired. Advantages of AIROBICC when compared to scintillation arrays are:
its natural gamma to hadron enrichment, by a factor two to six, lower
energy threshold and better angular resolution. On the other hand
observations are restricted to clear moonless nights. The energy threshold
is calculated from Monte Carlo simulations and from the measured cosmic ray
flux. Agreement is found.
Slide 4:
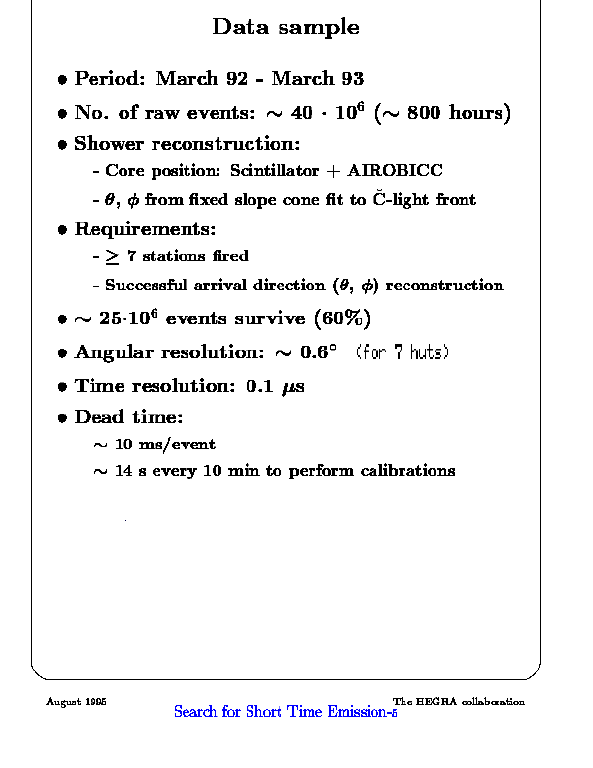 The data sample was recorded during the first year of operation of
AIROBICC and has about forty millions showers. The timing information of
the Cherenkov pulses is used to fit the light front to a cone of fixed
slope in the usual way. After selecting those showers with at least seven
huts fired and successful arrival direction reconstruction, about sixty per
cent of the initial showers remain. No other quality cuts are applied
because: first, the angular resolution is not critical and second, we want
to keep as much statistics as possible, so, in this case the angular
resolution is around point six degrees. A differential time resolution of
point one microseconds is achieved with a Rubidium clock. The mean dead
time for event readout is ten milliseconds and there is also a dead time
due to calibration, about fourteen seconds every ten minutes.
Slide 5:
 Now I'm going to talk about the search strategy. The time search window
is divided into several time scales. For short scales every incoming event
defines a search window. The ON source window is centered at the position
of the event and has a radius of point seven degrees. We define then, an
OFF source annular window for background estimation. Three different time
length are used: ten seconds, one minute and four minutes. The same
procedure is applied to a Monte Carlo sample ten times larger than the real
data sample.
In the long time scale we used a non-overlapping rectangular grid with
a step of half a degree in both, declination and right ascension. The time
length chosen was one hour. The background is estimated with one hundred
Monte Carlo events generated per every real event. As in the case of short
time scales, the same procedure is applied to a Monte Carlo sample twenty
times greater than the real data sample.
Slide 6:
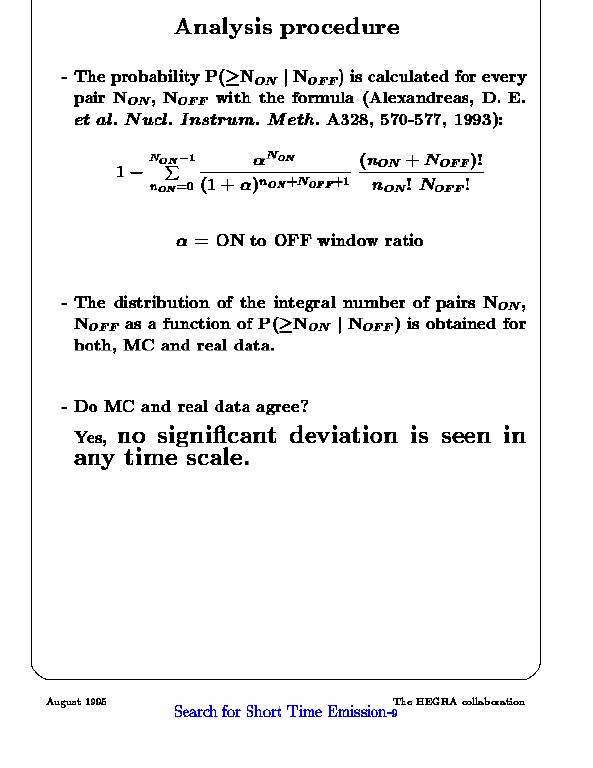 To carry out the analysis procedure we must obtain the probability of
observing at least Non events in the ON window given Noff events in the OFF
window for all the explored area in every time scale. We use the
probability distribution given by Alexandreas et al. in nineteen ninety
three. Then the distribution of the integral number of explored windows as
a function of this probability is obtained for both, Monte Carlo and real
data, and are compared.
No significant deviation is seen in any time scale.
Slide 7:
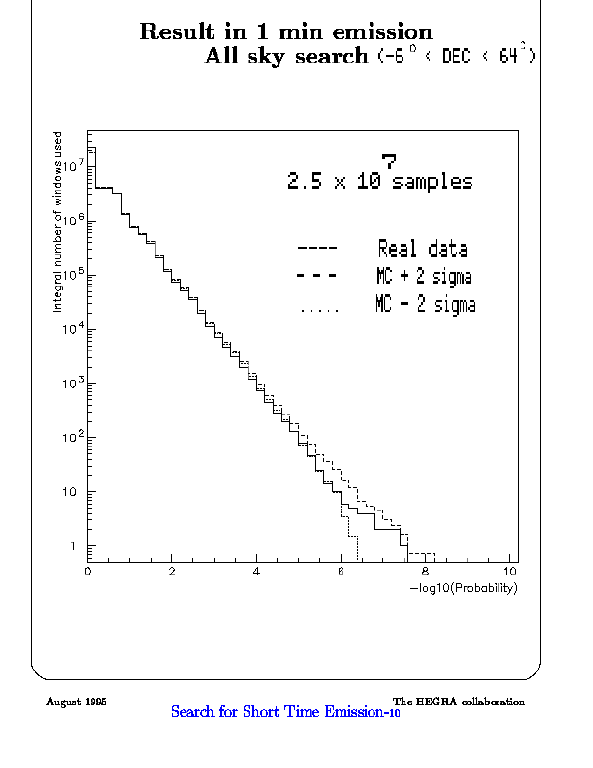 This plot shows the distribution for the 1 minute time scale. In the X
axis is the negative decimal logarithm of the probability and in the Y axis
is the number of times that it is seen a fluctuation with probability equal
or greater than that of the bin. The dashed line is the Monte Carlo plus
two sigma, the dotted line is the Monte Carlo minus two sigma and the
continuous line is the real data distribution. The sigma for each bin
corresponds to that of the binomial distribution approximately followed by
the content of every bin.
Similar plots are obtained for the other time scales.
Again, nothing below ten to minus eight is seen, what is expected for
more than twenty million windows tested. But a not very strong burst could
be hidden by so many windows.
Slide 7bis:
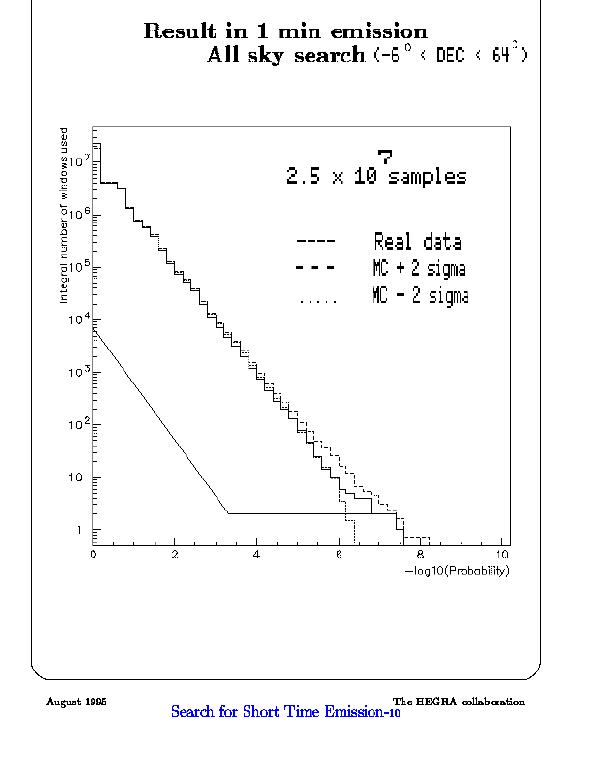 Adding a restriction, let say, a coincidence with a BATSE burst, our
sample is reduced and maybe something unexpected could emerge, just like
this.
Slide 8:
 Therefore we repeated this analysis for a subsample of data surrounding
gamma ray bursts given by BATSE. We searched within plus/minus ten degrees
of the reported position and in two time ranges: plus/minus three minutes,
looking for emission in coincidence and up to one hour later, looking for
delayed emission. This is the list of the bursts we searched for. The
marked burst is fully contained in our data.
Slide 9:
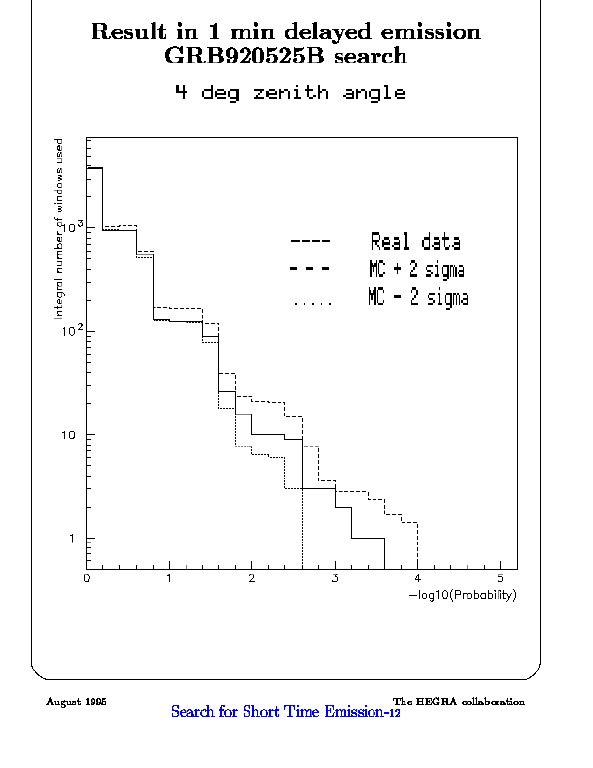 No significant deviation is found in our entire burst search, either
direct or delayed. As an example, this plot shows the case of the fully
contained burst. Again the full line is our data, the dashed line
correspond to Monte Carlo plus two sigma and the dotted line is Monte Carlo
minus two sigma.
Therefore flux upper limits will be given, but only for this burst and
for the all sky search.
Slide 10:
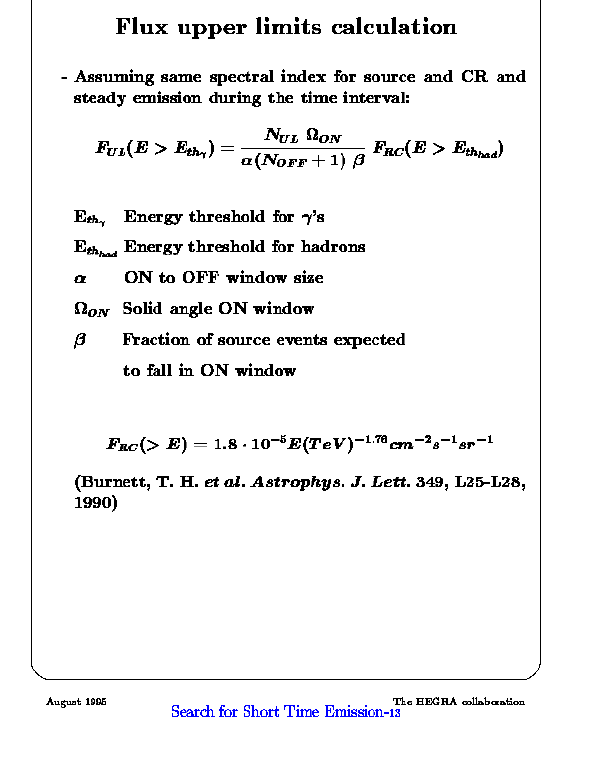 The flux upper limits are calculated assuming the same spectral index
for the source and the cosmic ray background and steady emission during the
time interval. We use this formula with the cosmic ray spectrum taken from
this reference. The limit is calculated for all the windows and is taken
the largest one found.
Slide 11:
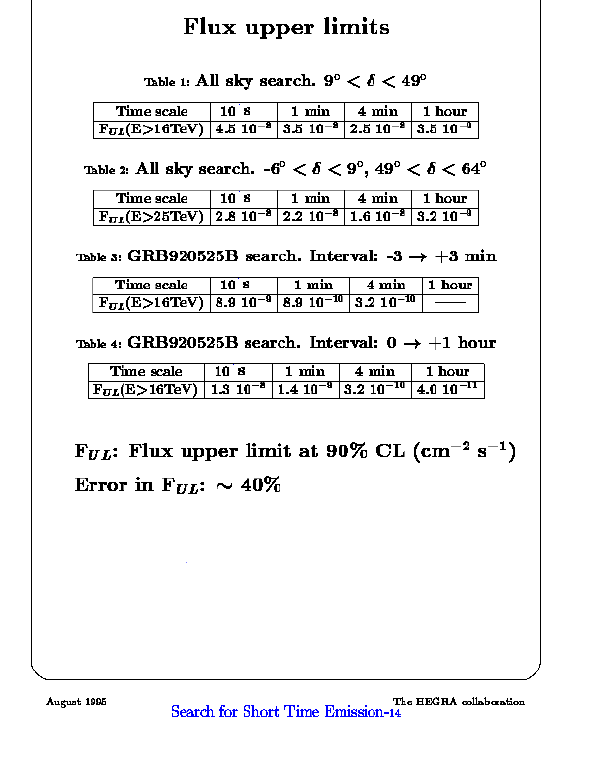 These are the ninety per cent confidence level flux upper limits
obtained. The threshold energy is different depending on the band of
declination. The flux limits range from ten to minus eight to ten to minus
eleven photons per square centimeter per second depending on the time scale
and the subsample. Uncertainties may be as high as forty per cent.
Slide 12:
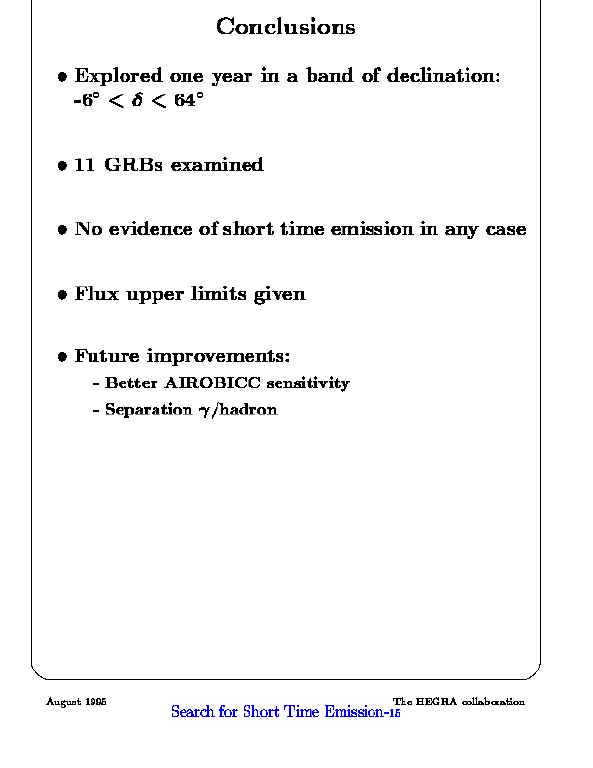 The conclusions are:
- A band of seventy degrees in declination has been searched for in the
ninety two/ninety three data.
- No short time emission is found. The search for direct o delayed
emission from eleven gamma ray bursts is also negative.
- Flux upper limits are given for the general sky search and for one
complete covered gamma ray burst.
- This analysis will be extended to the new AIROBICC data with a lower
energy gamma threshold of about twelve TeV. We will also try to reduce the
background by a simple gamma/hadron separation procedure.
E-mail: padilla at
domain "gae ucm es" (my PGP/GPG public key)
First version: 23-Jul-1996, last update: 13-Jan-1998
This link: http://www.gae.ucm.es/~padilla/work/rometalk.html

 Go to the parent page: Publications.


